
Microsoft Excel 16.93 (macOS)
One download for Apple Silicon and Intel. Opens the install steps and mirrors.
- Version
- 16.93
- Size
- 2.4 GB
- Earliest macOS
- 13 or later
- CPU type
- Universal
- Updated
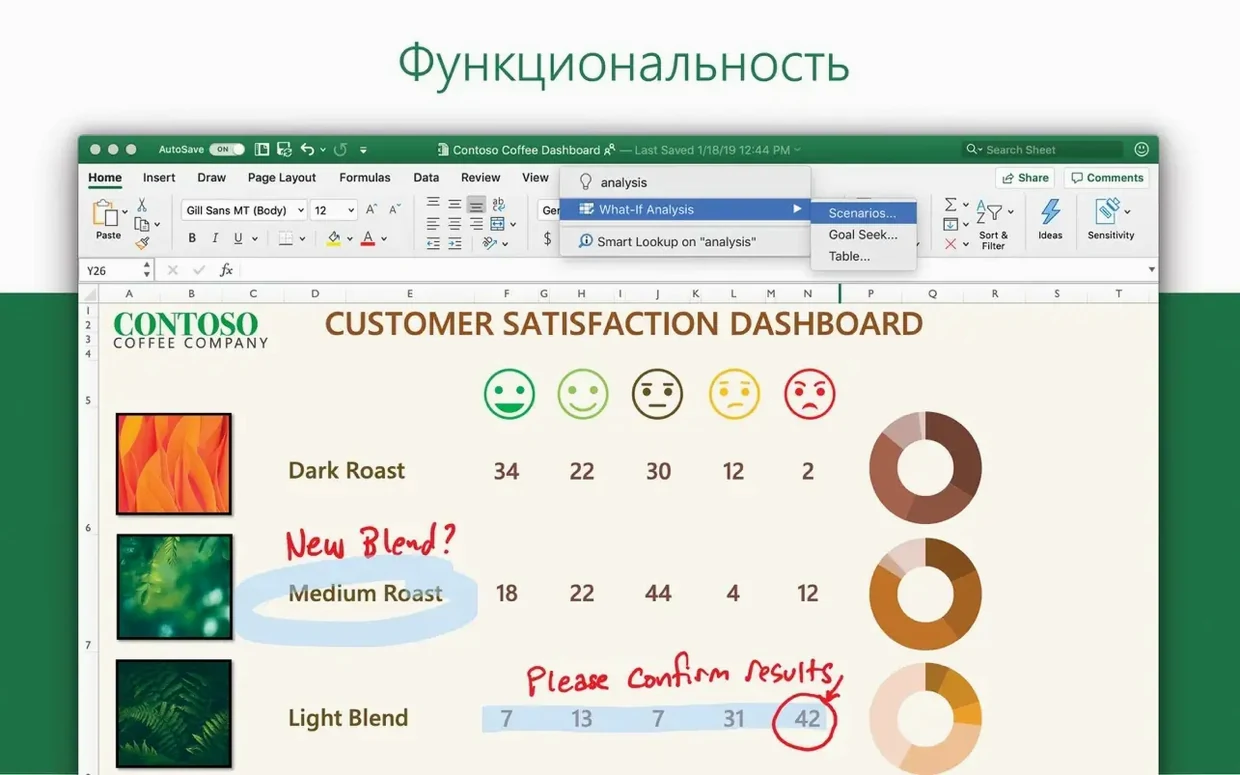

Accountants, auditors and anyone who lives inside a workbook will already know Excel. It is the spreadsheet app that ships with Microsoft 365 for Mac and Office LTSC Standard for Mac 2024.
macOS 13 requirement and Apple Silicon support
- macOS 13 or later
- Apple Silicon and Intel Macs supported
- Part of the Office LTSC Standard for Mac 2024 suite
Version 16.93 adds chart types and an Ideas pane
Version 16.93 brings new chart types and an Ideas feature that surfaces trends and patterns from selected data. You can create, view and edit .xlsx files, share workbooks for collaboration, and build the sort of financial models audit teams rely on. Interface languages cover Russian, German, French, Japanese and a dozen others.
Two-channel shipping model and coexistence with older Office
Microsoft ships Excel for Mac through two channels. If your workflows need real-time collaboration with colleagues on the current channel, that is the main gap to check.
Will it coexist with an older Office install already on the Mac? The standard install procedure expects a clean slate. Keeping a 2019 or 2021 version alongside 2024 can confuse the licensing components. The safest route is a full removal before dropping the new build on, then running the VL Serializer once.
Do admin rights matter? Yes. The VL Serializer writes licensing data to system-level directories, so standard users will trip over permission prompts halfway through. Push it out via MDM or run the installer from an admin account.
What about AutoUpdate? Microsoft AutoUpdate (MAU) is a separate install step listed in the package instructions. Without it, Excel 16.93 sits frozen; with it, you pull future patches the normal way.
What an auditor’s first afternoon looks like
The file arrives as .xlsx with fifteen sheets of raw ledger exports. Before lunch, she needs to pull out variances above a threshold and flag them for the senior review.
She opens the workbook, confirms the data spilled correctly across the sheets, and highlights the main transaction table. Rather than write nested IF statements from scratch, she clicks Ideas. Excel surfaces a few trends: a spike in travel costs in March, a supplier whose monthly totals have drifted upward quarter on quarter. The charts are not presentation-ready, but they give her the anomalies faster than scanning columns by eye. She copies the chart objects into a separate sheet, adds a short comment in a cell alongside each, and shares the file to OneDrive so the senior can pick it up that afternoon. Nothing in the process needed a Windows box or a plug-in.
Building a variance report from scratch
Start with a workbook that has two sheets: Actuals and Budget. Both carry the same row layout – account codes in column A, months across columns B through M. Create a third sheet called Variance.
On Variance, copy the account code column. In cell B2, write a formula that subtracts the Budget value from the Actuals value for the matching cell reference. Excel’s structured reference syntax keeps it readable without named ranges. Drag the formula across to December and down the account list. A quick conditional formatting rule on the entire table – green for positive, red for negative – makes the overruns obvious at a glance.
Now select the account rows plus the monthly columns and insert one of the new chart types from the 16.93 release. A treemap or waterfall, depending on the data shape, gives the finance director a visual version of the same table. Add a fourth sheet, paste the chart onto it, and resize for an A4 page. The whole sequence, from blank workbook to print-ready variance pack, takes under ten minutes once the source sheets are populated.
Ideas pane recalls your last analysed range
- Ideas pane recall. The Ideas task pane remembers the last range you analysed during a session. Switch sheets and click it again – it re-scans the current selection without needing to reopen the panel.
- Chart defaults carry the theme. New charts pick up the workbook’s colour theme immediately. If you set a corporate palette in the theme, every chart inserted from then on respects it; no reformatting per object.
- Multi-language interface switching. With twenty interface languages in the build, you can flip the display language from System Preferences > Language & Region without reinstalling Excel. The menus, function names and error messages follow the OS setting.
- VL Serializer handles the whole suite. Running the serializer once activates Word, PowerPoint and the rest alongside Excel. You do not need a separate activation step per app.
- New chart types added
- Ideas tool included for visualising data trends and patterns
- macOS 13 or later
- Apple Silicon or Intel processor
Staffroom comments 0
Sign in or create an account here to leave a comment.
Nobody has commented on this one yet.